
For decades, the public safety landscape in the United States operated under a significant informational delay.Municipal leaders, police executives, and criminologists evaluated gun violence trends using retrospective annual data released up to ten months after the close of a calendar year.That structural lag often left policymakers responding to yesterday’s crises rather than anticipating tomorrow’s risks.
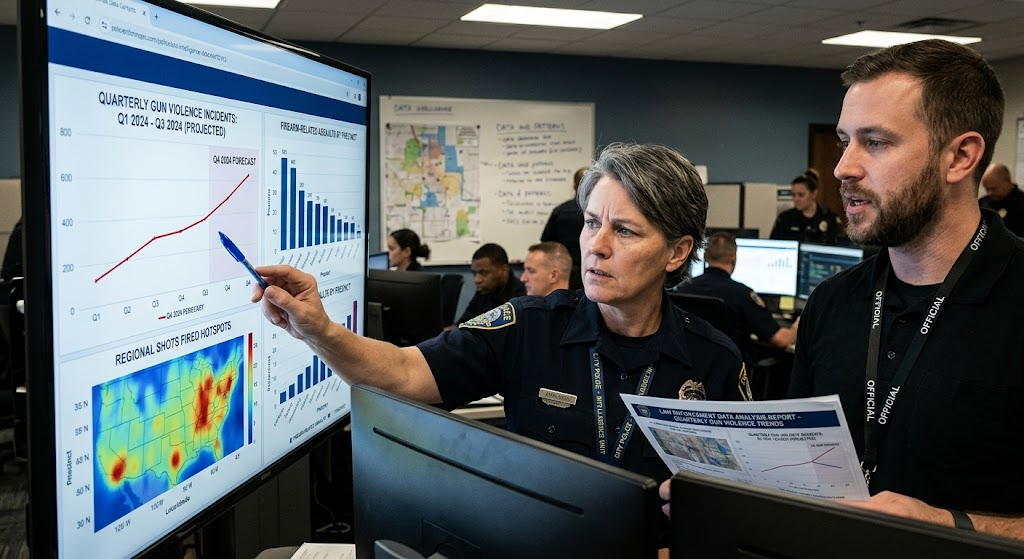
Today, a fundamental shift in law enforcement data architecture has transformed public safety forecasting.Driven by the widespread adoption of the Federal Bureau of Investigation’s National Incident-Based Reporting System (NIBRS), automated municipal dispatch logs, and independent analytical platforms like the Real-Time Crime Index, law enforcement agencies now evaluate crime metrics on a quarterly and monthly basis.
Recent quarterly law enforcement datasets reveal a dramatic, multi-year decline in homicides and non-fatal shootings across major American cities, marking one of the steepest drops in violent crime recorded in modern history. However, a closer examination of quarterly projections demonstrates that this overarching national decline is far from uniform. Criminologists and police analysts point to complex underlying variables—including seasonal volatility, weapon lethality metrics, spatial concentration, and shifting clearance rates—that dictate whether a city’s downward crime trajectory will endure or reverse.
The Quarterly Data Revolution: Shift to Real-Time Forecasting
The transition from annual post-mortems to quarterly predictive analysis represents a major operational evolution for law enforcement.Historically, crime mapping was reactive. Precinct commanders evaluated where shootings had already occurred, deploying resources to geographic sectors after violence had already taken hold.
Quarterly reporting frameworks, supplemented by rolling 12-month sums, allow crime analysts to identify emerging trajectories early.By tracking short-term fluctuations in aggravated assaults with firearms, robbery rates, and illegal gun seizures, predictive models generate rolling statistical forecasts for upcoming quarters.
QUARTERLY DATA FEED SOURCES
- NIBRS Monthly Incident Offense Logs
- 911 Computer-Aided Dispatch (CAD) Calls for Service
- Acoustic Gunshot Detection System Alerts
- ATF eTrace Firearm Recovery Metrics
- Regional Emergency Department Trauma Intake Logs
This rapid-intake methodology allows departments to adjust tactical deployments ahead of historical friction points. When quarterly data signals an uptick in retaliatory group violence or a shift in illegal firearm distribution networks, municipal leaders can realign patrol shifts, deploy community violence interrupters, and target social service resources before seasonal spikes materialize.
Anatomy of the Decline: What the Numbers Show
Data published by the FBI’s Uniform Crime Reporting program, alongside preliminary feeds from over 500 participating law enforcement agencies, indicates that the historic surge in violent crime observed between 2020 and 2022 has unwound at an unprecedented pace.
National quarterly reports document significant year-over-year reductions in gun-involved violent crime:
- Homicides:Murder offenses dropped by an estimated 18.1 percent from 2024 to 2025, with early quarterly data for 2026 showing an additional 16 to 17 percent year-to-date decline.
- Aggravated Assaults:Non-fatal firearm assaults declined between 7 and 9 percent annually, signaling a broad reduction in overall shooting incidents.
- Robberies with Firearms:Armed robbery offenses decreased by more than 18 percent over consecutive quarterly evaluation periods.
Because firearms are involved in approximately 70 to 75 percent of all homicides nationwide, the drop in overall murder rates is almost entirely driven by a reduction in gun violence.
Criminologists analyzing quarterly trends note that gun violence exhibits a pronounced seasonal cycle. First-quarter logs (January through March) routinely register the lowest annual shooting volumes due to colder weather and reduced outdoor mobility. Second-quarter (April through June) and third-quarter (July through September) data consistently show sharp upward spikes as rising ambient temperatures and unstructured youth time increase social interactions in public spaces.
The significance of recent quarterly projections lies in the baseline comparison: even when accounting for mandatory summer surges in Q2 and Q3, peak seasonal shooting volumes in recent quarters remained substantially below the seasonal peaks recorded during the 2020–2022 era.
The Lethality Paradox: Shootings, Firearm Tech, and Caliber
While total shooting incidents have decreased, criminologists closely monitor a critical sub-metric embedded within quarterly police data: firearm lethality—defined as the ratio of fatal homicides relative to total non-fatal shooting incidents and aggravated assaults with firearms.
Data compiled by the Council on Criminal Justice (CCJ) reveals a troubling historical divergence.Even as overall gun violence rates have dropped from pandemic-era highs, the lethality per incident in many metropolitan areas remains elevated compared to pre-2020 baselines.
Law enforcement analysts attribute this “lethality paradox” to three technological and mechanical factors:
1. High-Capacity Magazines and Rapid-Fire Conversion Devices
The proliferation of illegal machine gun conversion devices—commonly referred to as “auto-sears” or “Glock switches”—has dramatically altered the mechanics of urban gun violence. These small metal or plastic components convert standard semi-automatic handguns into fully automatic weapons capable of firing up to 1,200 rounds per minute. Quarterly ballistics logs show a dramatic increase in the average number of shell casings recovered per shooting scene, raising the probability that a single incident will result in multiple victims or fatal wounds.
2. Shifts in Caliber and Ammunition Ballistics
Quarterly ballistics tracking from municipal crime laboratories indicates a shift toward larger-caliber handguns and high-velocity rifle rounds in street-level recoveries. Higher-velocity rounds cause more extensive physical trauma, reducing the likelihood that emergency medical intervention can save a victim’s life.
3. Medical Interventions as a Counterweight
Counteracting the increase in weapon firepower is the rapid integration of advanced trauma protocols. The widespread deployment of tourniquets among frontline patrol officers, combined with real-time acoustic gunshot location systems that dispatch emergency medical services directly to exact GPS coordinates within seconds, has prevented hundreds of non-fatal shootings from becoming homicides. Consequently, quarterly murder totals are increasingly sensitive to the speed and proximity of emergency medical care.
FIREARM LETHALITY FACTORS
Factors Increasing Lethality:
  - Rapid-fire conversion devices (auto-sears)
  - Extended magazine capacities
  - Higher bullet velocity and caliber

Factors Suppressing Lethality:
  - Rapid officer-administered trauma care (tourniquets)
  - Real-time acoustic gunshot dispatch
  - Proximity to Level-1 Trauma Centers
Micro-Geographic Precision and Hotspot Dynamics
Quarterly crime logs continuously reinforce one of the most established tenets of environmental criminology: gun violence is highly concentrated in specific geographic micro-zones.
Statistical modeling demonstrates that in almost every major city, more than 50 percent of all reported shootings occur on less than 5 percent of street blocks. These micro-locations—often characterized by vacant properties, unlit alleys, concentrated liquor outlets, and active illicit drug markets—remain primary drivers of quarterly figures.
Modern predictive policing leverages this spatial concentration. By feeding quarterly NIBRS data, 911 dispatch calls, and environmental risk terrain variables into machine learning algorithms, crime analysts generate probability maps for upcoming quarters.
Rather than conducting broad neighborhood sweeps that risk alienating local residents, police departments use these quarterly projections to execute “hotspot operations.” These tactics focus high-visibility patrols, foot sweeps, and physical infrastructure improvements—such as repairing streetlights and clearing abandoned lots—on specific high-risk intersections during peak risk hours.
The Role of Community Violence Intervention and Social Policy
Law enforcement executives increasingly acknowledge that police deployments alone cannot sustain long-term reductions in gun violence. The sustained downward trends observed in recent quarterly reporting coincide with unprecedented federal, state, and philanthropic investment in Community Violence Intervention (CVI) ecosystems.
CVI programs operate parallel to law enforcement, utilizing non-law enforcement violence interrupters, street outreach workers, and hospital-based intervention specialists to disrupt cycles of retaliatory violence.
- Hospital-Based Violence Intervention (HVIP): Specialists engage shooting victims directly in hospital trauma bays immediately following an incident, offering social services, relocation assistance, and mediation to prevent retaliatory shootings in subsequent quarters.
- Focused Deterrence: Multi-agency partnerships identify the tiny fraction of individuals driving high-risk group disputes, offering direct educational, employment, and housing support while clearly communicating the swift legal consequences of continued firearm violence.
- Summer Youth Employment Programs: Quarterly data shows that cities expanding paid summer youth internships experience measurable drops in juvenile gun violence victimization during the volatile third quarter.
When CVI efforts are coordinated with police data-sharing, cities report accelerated drops in retaliatory shooting chains, providing a structural buffer against seasonal crime spikes.
Strategic Challenges: Clearance Rates and Data Blind Spots
Despite the sophistication of modern quarterly analytics, criminologists caution against over-reliance on predictive models without addressing significant data blind spots.
The most critical operational vulnerability facing public safety agencies is the ongoing decline in homicide and shooting clearance rates.Nationally, the homicide clearance rate—the proportion of cases solved by arrest or administrative closure—has fluctuated around 50 percent in recent years, down from over 90 percent in the mid-20th century. For non-fatal shootings, the clearance rate is drastically lower, often falling below 20 percent in major urban centers.
Low clearance rates create three distinct problems for quarterly forecasting:
- Unresolved Retaliation Risk: Unsolved shootings leave active shooters on the street, escalating the statistical probability of retaliatory violence in subsequent quarters.
- Community Non-Cooperation: When residents believe police will not solve violent crimes, willingness to testify or provide eyewitness accounts drops, degrading the quality of investigative data.
- Data Distortions: Projections based purely on arrest records measure law enforcement activity rather than actual criminal incidence, creating feedback loops that can misallocate resources.
Furthermore, quarterly crime projections remain vulnerable to external macroeconomic and social shocks. Sudden shifts in local drug market dynamics—such as the rapid introduction of novel synthetic opioids or illicit stimulants—can trigger localized turf disputes that disrupt quarterly forecasting models within weeks.
Sustaining the Downward Curve
The evidence embedded within recent quarterly law enforcement reports offers a compelling narrative: the historic spike in gun violence that severely impacted American communities between 2020 and 2022 has receded, replaced by a sustained, broad-based downward trajectory in homicides and armed offenses.
However, maintaining this progress requires moving beyond short-term celebratory announcements. Quarterly law enforcement data should be viewed not as a scoreboard, but as a diagnostic tool.
Sustaining the downward curve will depend on the ability of municipal leaders to pair real-time crime data with comprehensive public safety investments. By combining targeted law enforcement deterrence at micro-geographic hotspots with robust community violence intervention programs, technological ballistics tracking, and structural investments in neglected neighborhood infrastructure, cities can build a resilient public safety architecture capable of preventing future spikes in gun violence.
Leave a Reply